Flora Research Platform
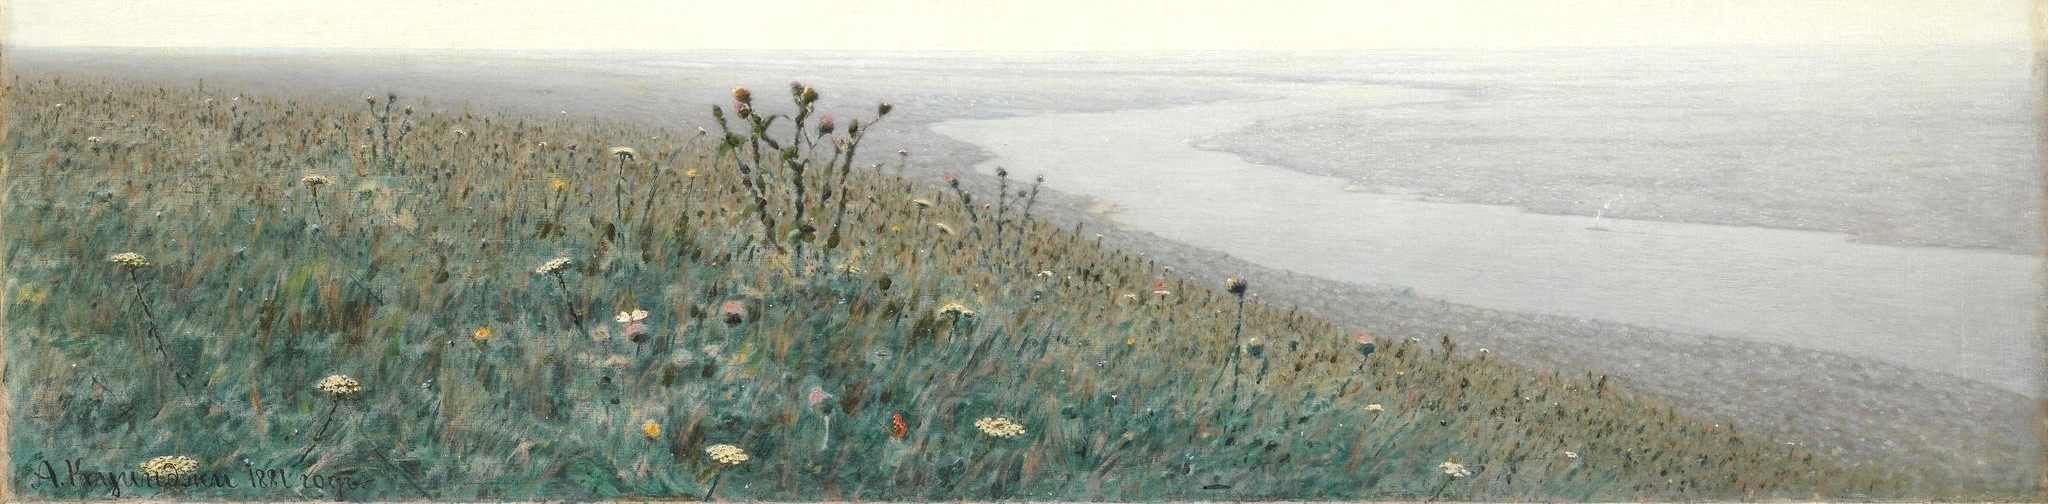
One of the most important characteristics of the flora data is that it documents the habitat(s) in which each species of plant grew. The language of the primary source gives us a clear sense of the elements that composed the area around Odessa in the 1890s - of the meadows, sand, and coastline. There were marshes and rocky areas, gardens and riverbanks. We can almost smell the salt.
But here's the catch.
We don't know which meadows Shesterikov studied. We don't know which "sandy areas" he explored. We don't even know where the sandy areas were in the 1890s. When Shesterikov tells us he saw German madwort (Asperugo procumbens) growing in abundance along a roadside near the village of Großliebental we can map the village but go no further. It's the equivalent of telling someone to go find the maple trees growing on "the street" in the city of Cambridge, Massachusetts.
Time to get creative.
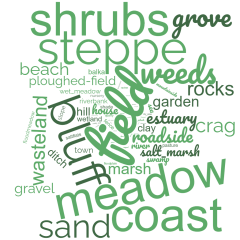
Consult the treemap of the frequency of habitats listed in the Flora Odessa.
Once you have a sense of the distribution pattern, start your research into species prevalence, growth type, habitat, and observation site. Pan, zoom, and click on individual plant observations. The key to exploring the data is to use the filter buttons (see the floral icons in the "not-a-map" below). It might take a minute for the data to load - there is a lot of it. Patience will be rewarded.
Use the data wisely.
- We drew the approximate boundary of Shesterikov's research area. The area allocated to each plant family is determined by the number of species observations. Each observation is represented by a colored dot. Remember, that dot is not a placemark: it tells you which family the observed plant belongs to rather than where it was observed. A quick glance will tell you that Shesterikov observed far more plants belonging to the Sunflower family than to the Orchid family. Remember, that does not necessarily mean there were more sunflowers than orchids: it only means that more are attested in the Flora Odessa.
- Use the habitat, prevalence, and observation site filters (see the floral icons along the "map" edge) to sift through the data.
- Pan/zoom, and use the "home" button.
- Click on any plant observation for full details, including species and family names, information on habitat, growth type, prevalence, observation method, and observation site.
- Each observation includes a link to the entry in the Global Biodiversity Information Facility: an authoritative data infrastructure with global coverage.