counting sheep slice
1 2024-02-15T00:36:32-05:00 Kelly O'Neill dc20b45f1d74122ba0d654d19961d826c5a557f5 9 1 plain 2024-02-15T00:36:32-05:00 Kelly O'Neill dc20b45f1d74122ba0d654d19961d826c5a557f5This page is referenced by:
-
1
2024-02-14T14:51:30-05:00
Farmlands: Counting Sheep
54
Animals were the engines of empire. Find out where the sheep (and horses and camels) were in the 1860s.
plain
2025-04-22T16:11:49-04:00
What It Is
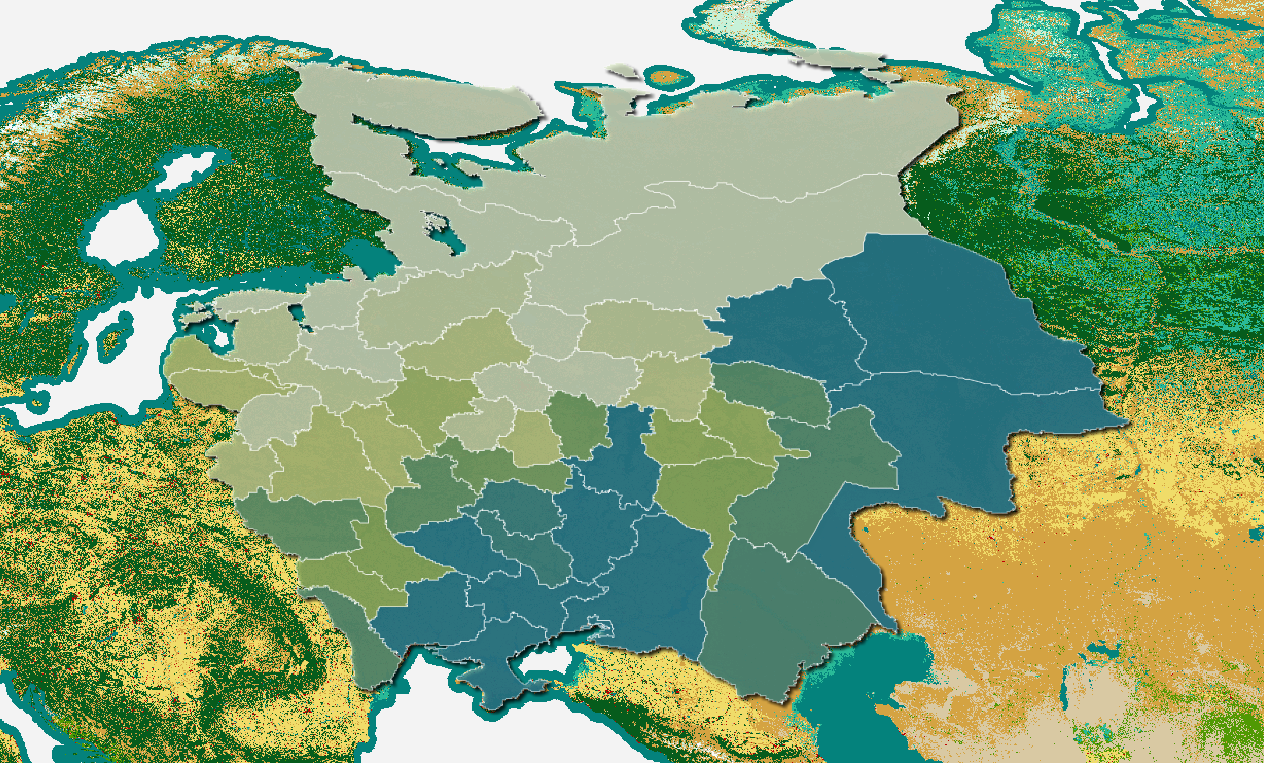
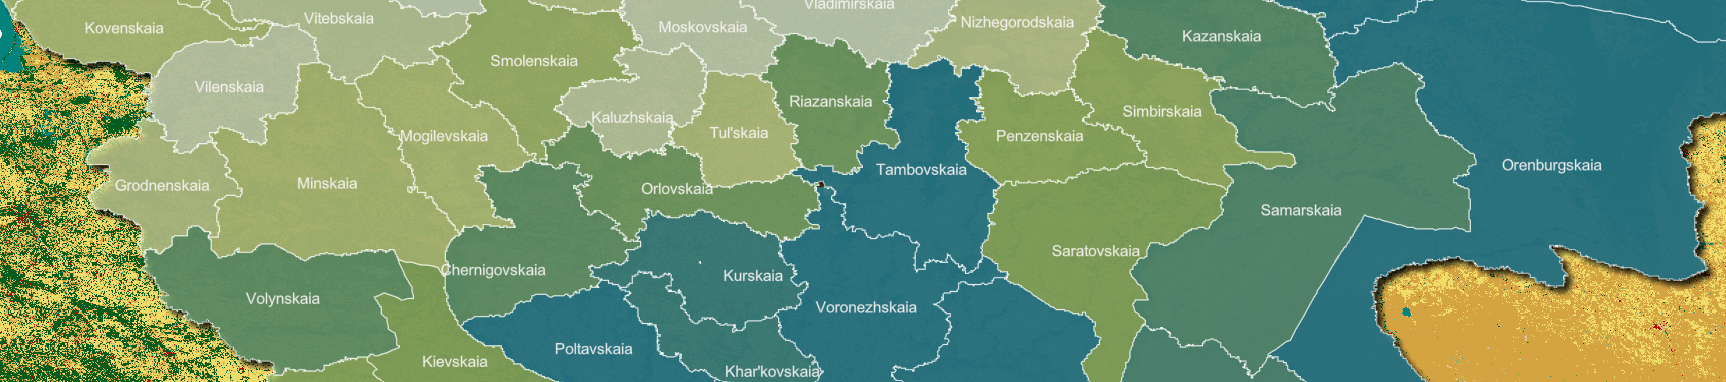
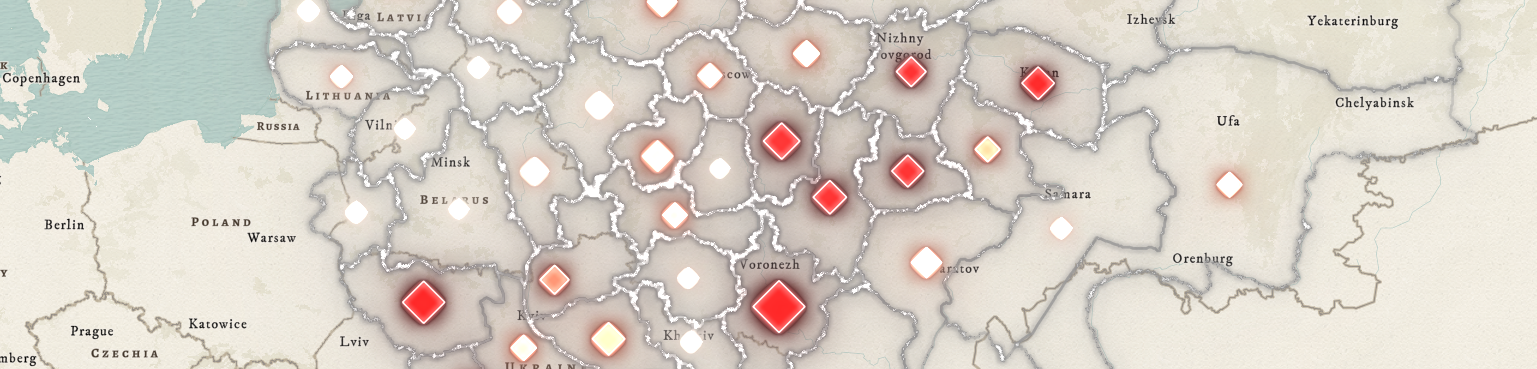
This dataset contains information about the population size and diversity of livestock in 49 provinces of European Russia based on a census compiled by the tsarist government in the middle of the 19th century. You will find population counts for the eight most prominent agricultural animals in the region: cattle, reindeer, goats, horses, ordinary sheep, fine-fleeced sheep, swine, and camels.
GET THE DATA
Explore the maps
About the Primary Source
Citation: Центральный статистический комитет Министерства Внутренных Дел [Central Statistical Committee of the Ministry of Internal Affairs], Статистический временник Российской империи выпуск I [Statistical yearbook of the Russian Empire, Issue 1]. Saint Petersburg: Ministry of Internal Affairs, 1866.
Part of a two-volume series, the first issue of the Statistical Yearbook was compiled by the Central Statistical Committee helmed by the famous and formidable Pyotr Petrovich Semyonov-Tyan-Shansky (1827-1906). Semyonov served as director of the Statistical Committee from 1864-1875 though he is more commonly recognized for his role as director of the Imperial Russian Geographical Society and his exploration of the Tyan Shan Mountains. This publication, one of the first of his tenure, was created with the goal of providing a broad statistical picture of the geography, demographics, and economy of the Russian Empire.
The source of this dataset is the eleventh table in the second section of the volume. It records the number of horses, horned cattle, ordinary and fine-fleeced sheep, goats, swine, reindeer, and camels reported in each province in a single year. The provinces of the Kingdom of Poland, Grand Duchy of Finland, and the Caucasus are not included. See pages 242-243 [images 464-465].Historical Context
Animals and empires go hand in hand. Wild animals and domestic pets have always been celebrated in media and art, but livestock have provided humans with sustenance, mobility, and power for millennia. The history of livestock is a history of farmlands, battlefields, commerce, and imperial politics. Within the Russian Empire, horses and camels played key roles in interactions with rival powers such as the Mongol, Qing, and Ottoman empires, while sheep and cattle figure prominently in literary and artistic depictions of the countryside as well as in the development of domestic and international markets. Despite their significance, livestock are a neglected topic. This dataset provides a window onto their world and an opportunity to define countless question for further research.
Project Team
Olga Kiyan, Kelly O'Neill, Paul VădanPublication Date
15 February 2024
-
1
2025-02-27T08:24:45-05:00
Teaching with Maps
41
plain
2025-02-28T09:39:50-05:00
The resources on this page support the "Primary Sources in the Classroom: Teaching with Maps" seminar hosted by the Davis Center's Outreach Program and Imperiia Project on February 27, 2025. If you have questions about the material or are interested in attending map-related workshops, drop us a line at imperiia@fas.harvard.edu!Ready to study a historical map?
This town plan of Kyiv was produced in the late 1880s. As a physical object it is roughly 19"x17" (and a copy recently sold for over $2,000 at auction!). The map is in Russian, but do not despair. This is part of the fun. You will see.
Would you prefer a full screen version? Clicking here will open a new window with the high-resolution copy held at the David Rumsey Map Collection. Speaking of which...Looking for high-resolution, well-documented, open-access maps? Try these repositories:
- Library of Congress: https://catalog.loc.gov/
- David Rumsey Map Collection: https://www.davidrumsey.com/
- Harvard Library: https://library.harvard.edu/
Now back to our long look at Kyiv in the 1880s.
There are many ways to study a map. As tempting as it is to start with the typical historical questions (who made it? why? for whom?), we recommend setting those questions aside, taking a deep breath, and trusting your eyes. That is, we recommend starting by studying the graphic language of the map. Try moving through the following 3 exercises. Each challenges you to name what you see. Nothing more, nothing less.- Start unpacking the graphic language of the map by exploring COLOR. How many colors do you see?
- Next, how many map elements can you identify? (Not sure what a map element is? Consult the note cards below.)
- Finally, name as many feature types as you can. (Not sure what we mean by feature type? Consult the note cards below.) I have annotated the map so that non-Russian speakers can get a better sense of the elements of the built environment. (I haven't annotated the natural features.)
Want to work with the map in full screen? Click here or go to https://imperiia.omeka.fas.harvard.edu/items/show/4752
Now that you have broken the map down into its constituent parts, spend some time trying to identify the graphic hierarchy (see below). What decisions did the mapmaker make in an attempt to direct your gaze (and your mind)?
Finally, take your long look to the next level by identifying patterns, and perhaps even spatial relations. Use the list of spatial concepts to guide your work.