TAV Glance
1 2024-03-28T09:48:04-04:00 Paul Vadan f46fd2a7a6d2ab1ecca0ec13c84118eaf61facfa 9 1 plain 2024-03-28T09:48:04-04:00 Paul Vadan f46fd2a7a6d2ab1ecca0ec13c84118eaf61facfaThis page is referenced by:
-
1
2023-03-16T09:30:56-04:00
(Im)Probable Passages
51
Modeling Immigration to the United States from the Russian Empire Across the Nineteenth Century
image_header
2024-05-07T13:56:29-04:00
Synopsis
This project examines the spatial and social history of migration in its many forms (voluntary and coerced, individual and collective). Our goal is to enhance the growing body of knowledge about Eurasian migration with a collection of datasets, maps, and visualizations that deliver deep dives into specific historical episodes.
(Im)Probable Passages
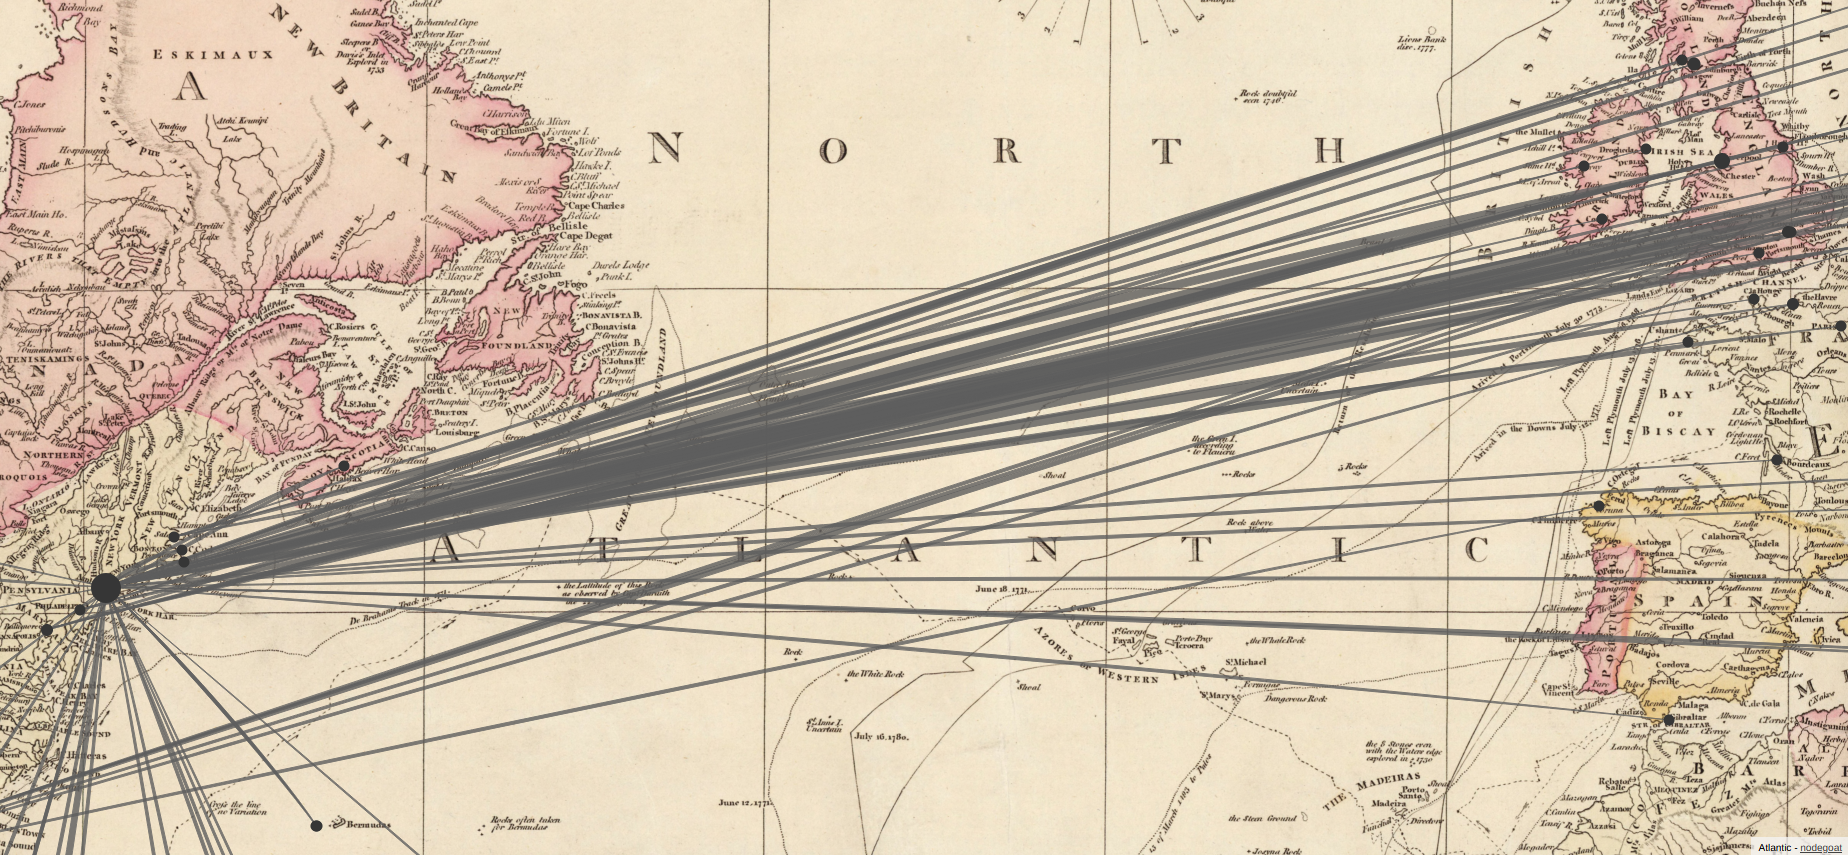
The centerpiece of the project is a large dataset provided by the U.S. National Archives consisting of half a million passenger arrival records and ship manifests across six decades (1834-1897). The data is vast and rich, but difficult to use in its raw form. In an effort to increase the usability of the records we reorganized, decoded, tidied, and enhanced. We even built statistical models that allowed us to test the spatial and thematic patterns embedded in the records. We identified the inconsistencies and documented the ambiguities. In a nutshell, we converted messy historical records into data you can feed into your favorite GIS software or visualization app.
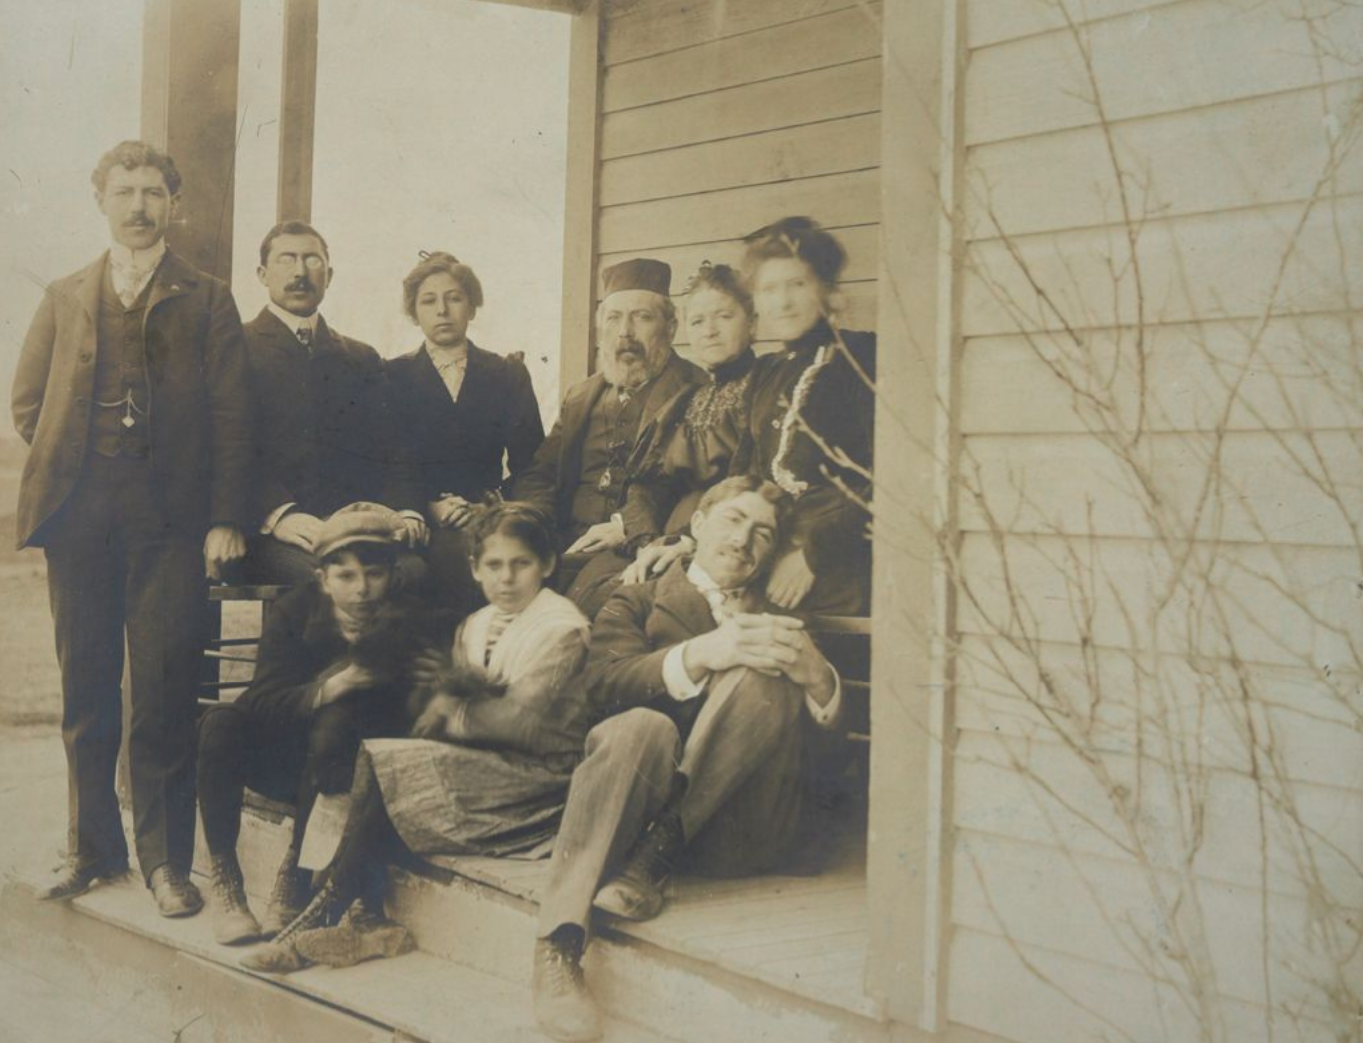
This is the most human dataset we have produced. Sure, the records offer woefully limited sketches of the men, women, and children who set sail for the United States, but without them we might not know anything about the existence of the teenage ginger maker named Abraham Limbowsky, who sailed on the Werkendam in 1897, the 24 year-old confectioner from Dunaburg named Salomon Starobin, or the 44 year-old midwife named Marin Ward, who sailed to New York on the Wisconsin in 1891. When taken together, these sketches paint a vibrant portrait of the social landscape of imperial Russia.
Feature List- 527,394 passengers
- 10,761 voyages
- 781 ships
- 681 occupations
- 182 last known residences
- 150 voyage routes
- 78 port locations
Ready to reconstruct the social and cultural identities of those who left the empire behind, as well as the political, economic, and geographical contexts through which they moved? We will be posting a series of visualizations and maps right here, but there is no need to wait: we published our edition of the data under an open-access license. We invite you to play with it, improve on it, build new tools with it, and share your work with us!At a Glance
Phase 1: The Imperiia team will consolidate the gathered data from the National Archives and private collections, which will in turn allow the creation of a Demo version of the application that will showcase some of the cutting-edge functions and research paths that historians and history enthusiasts will be able to follow as they learn more about trans-Atlantic migration in the 19th century.
Phase 2: At this crucial stage, we will develop models and analytical tools that will leverage Machine Learning and Artificial Intelligence to explore predictive analytics and deeper trend analysis within the relational database, with the added depth from the literature review, to offer a unique app user experience in exploring the database and generating historical possibilities.
Phase 3: Imperiia team members and collaborators will publish their findings through freely accessible databases, academic papers, and student workshops as part of its educational push to incorporate the project applications into educational curricula that will offer students an innovative way to learn about Trans-Atlantic History and Migration Studies.Go to the Data Catalog
Authors: Vivian Wei, Kelly O'Neill