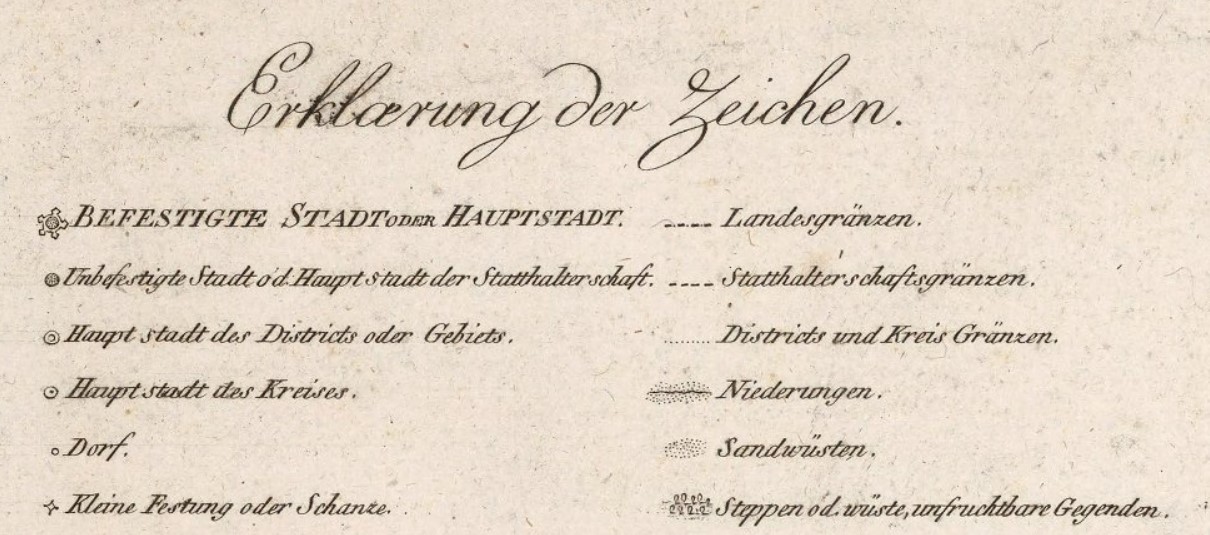
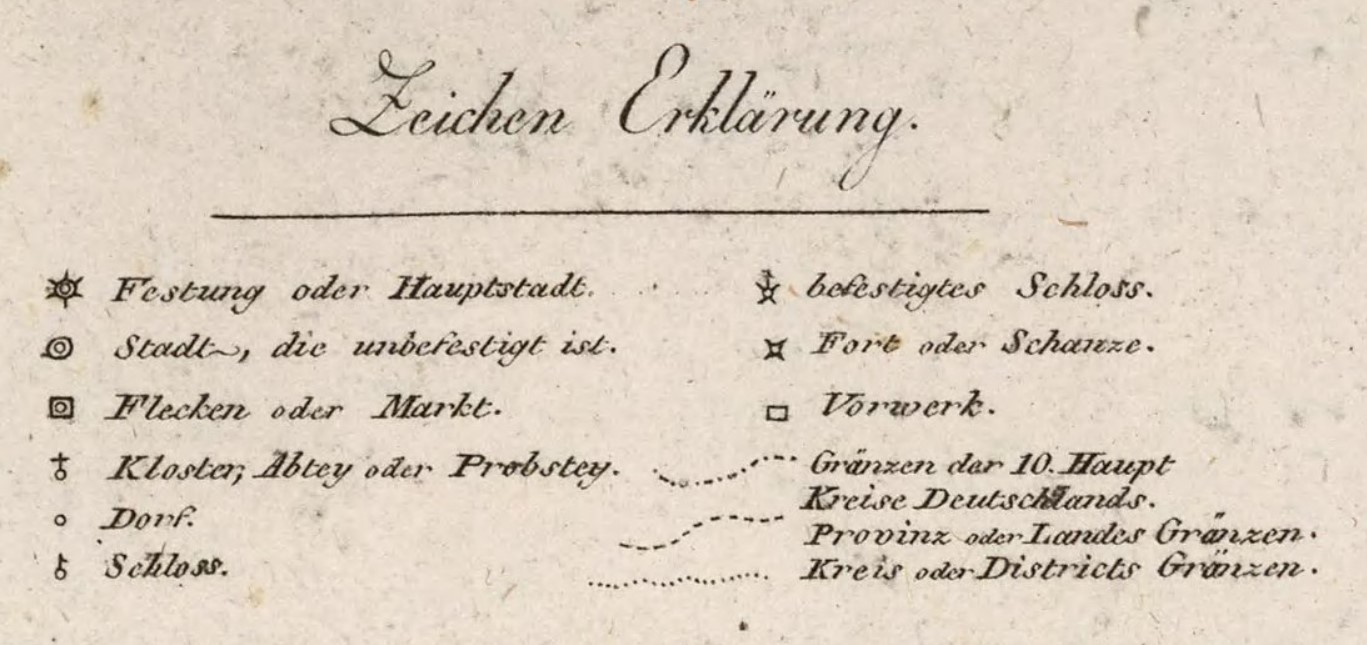
legend for the map of Germany in the Grosser Deutscher Atlas (1795-1796)
1 2020-11-23T16:39:50-05:00 Kelly O'Neill dc20b45f1d74122ba0d654d19961d826c5a557f5 9 1 plain 2020-11-23T16:39:50-05:00 Kelly O'Neill dc20b45f1d74122ba0d654d19961d826c5a557f5This page is referenced by:
-
1
2020-11-20T13:48:09-05:00
Russia as Rectangle: learn to read a late 18th century data viz
114
plain
2026-06-30T12:30:30-04:00
Have you always wanted to see the world as a series of nested rectangles?
Of course you have!
(...haven't you?)
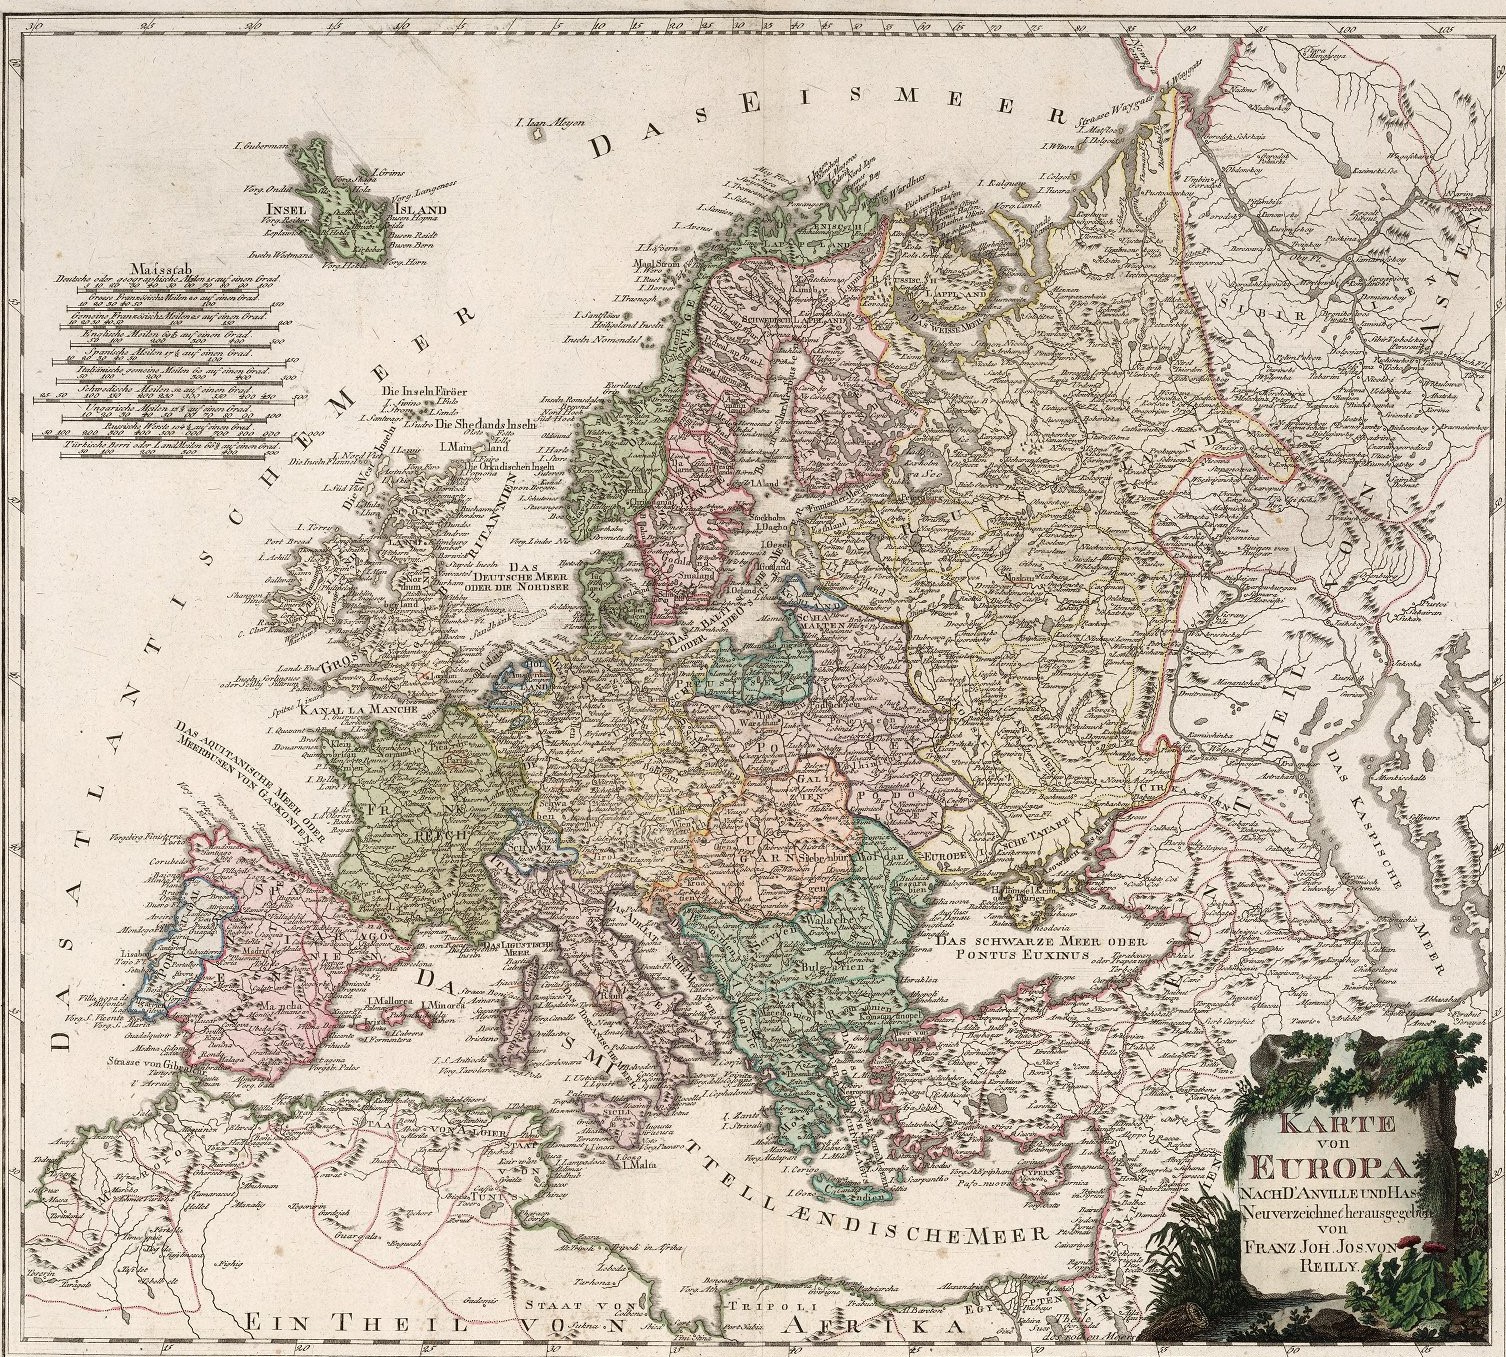
Let's agree that you have. Because if so, you are in luck. You see, in 1795, Franz Johann Joseph von Reilly published an atlas of the world. He called it (somewhat unimaginatively) the Large German Atlas. It contained 27 double-page engraved maps, complete with hand-colored outlining and title cartouches. To get a sense of the work, have a look at the "Map of Europe" that comes at the beginning of the atlas:
It is remarkable for being the first Austrian-made atlas of its kind, which is a perfectly lovely claim to fame. (To learn more about the atlas click here for full metadata and access to the high resolution image via the David Rumsey Map Collection.)
However, the Large German Atlas is also worth celebrating because it delivers an astonishing data visualization - cutting edge for its time, and masterful by today's standards. Here it is:
It is shocking, don't you think?
There on sheet III, the European world is completely reimagined. Geographical context has been stripped away. North and south have been rendered meaningless. Our sense of proximity and our ability to determine adjacency have been compromised.
The visualization renders Europe as a series of nested rectangles. Or, more accurately, it organizes Europe according to two variables: area (the bigger the rectangle, the larger the total square miles of territory), and population density. (In terms of the latter, states are organized from least to greatest beginning at the top of the left hand column to the bottom, then over to the top of the right column down to the territory with the greatest population density.)
In order to make the brilliance of the viz more legible, we have made it interactive.
To learn to use it, click the "About" button in the display below. (Go straight to a fullscreen view by clicking here.)Fun! But does the viz tell us anything we can't learn by looking at the maps?
See for yourself.
It takes a bit of work, in the form of clicking and zooming and making notes, but that is nothing you can't handle. Can you tease out any correlations? Can you identify any interesting comparisons? Are you struck by any curiosities in the data?
Here are a few prompts to get you started.
Hunt for Outliers- Identify the 5 largest rectangles by area. (Pay close attention - two share a rectangle, so be sure to click on both state names to get the data.) Look closely at where they fall in the order of population density. You will find that 1 is not like the others.
- Start with population density. Move your cursor over the 10 entries with the highest population density, with an eye to comparing their areas. You will find that 1 is not like the others.
Connect and Untangle- Several states are represented by more than one rectangle. Can you find all of the groupings? Can you make sense of the relationships?
- For each state/territory, find the the rectangle closest in size (in terms of area). For example, England is closest in area to Iceland. Then find the state most alike in terms of population density. Feeling ambitious? Do the same for total population. Do you see any pairings that hold across multiple variables? When you are ready, move on to use the maps.
Use the Maps to Dig Deeper- Carry the work you did above further by reintroducing geography into the system of comparisons. Are the states/territories that bear the closest resemblance geographically close to one another? If not, do they share other common characteristics (in terms of shape, access to coasts, etc.)? You can access the relevant page of the atlas through the interactive viz or flip through them by clicking here.
- Or try your hand at a close reading of states that are, as the saying goes, alike-but-different: Poland and France
Study Russia's Place in the (European) World
Let's start with the map.
What does European Russia look like in the Large German Atlas?
Does it look like the other European states presented on other sheets in terms of its organization? coloration? shape? scale? Does it have any distinguishing characteristics? (To answer these questions, you will need to pan and zoom and do a bit of "close looking.")
What does it contain?
Does it contain the same sorts of "things" as other European states? To answer this question, you might start by comparing the symbols in use on the sheets. First the symbols for Russia. Then, perhaps, the symbols for Germany. Are they the same in form and/or content?
Where does European Russia begin and end?
Where are its boundaries? Do they align with "natural" features? Are they surprising in any way?
Finally, having studied the map for a while, come back to the visualization.
Remind yourself what the rectangles have to say about Russia and how they place Russia within a system of relationships. How does that Russia - or that way of seeing - compare with the Russia described on the maps? Which gives you a better sense of Russia's place in the European world? Or do the map sheets and the nested rectangles work together to reveal a Russia you couldn't otherwise see?
You have questions now, don't you.
Good.
Take them with you into your study of Europe on the edge of the Napoleonic Wars, of Russia on the eve of becoming a world power, of data visualization as an instrument of political imagination... or of any one of the thousands of lines of history traced into the atlas.
Access the collection of digitized maps by clicking here.